Graphical presentations on population dynamics of the Finno-Ugric/Samoyedic groups up to the year 2010
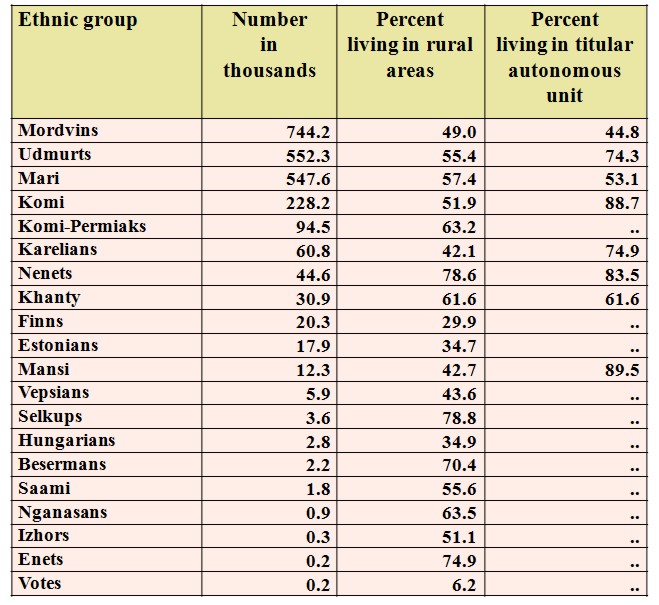
1. Finno-Ugric and Samoyedic groups singled out in the all-Russian population census of 2010
6. Age-sex distribution of the total population and Finno-Ugric population: Russian Federation, 2010
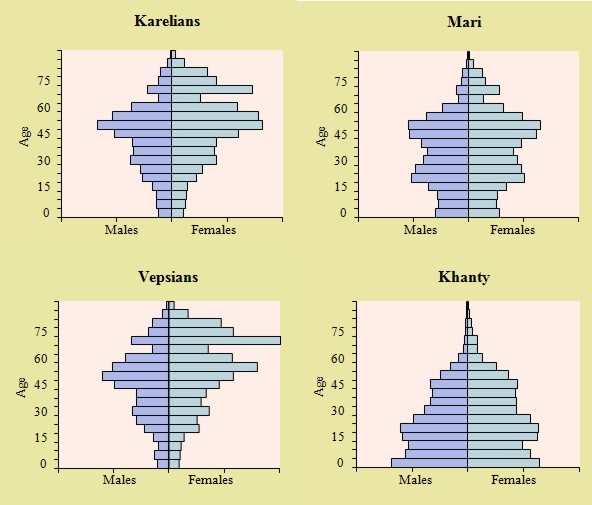
7. Age-sex distribution of the Karelians, Mari, Vepsians, and Khanty: Russian Federation, 2010
Sources:
Итоги Всесоюзной переписи населения 1959 года. РСФСР. М.: Госстатиздат, 1963.
Итоги Всесоюзной переписи населения 1970 года. Том IV. М.: Статистика, 1973.
Численность и состав населения СССР. По данным Всесоюзной переписи населения 1979 года. М.: Финансы и статистика,1985.
Итоги Всесоюзной переписи населения 1979 года. Том IV. М.: Госкомстат СССР, 1989.
Некоторые исторические и статистические материалы о населении финно-угорской группы и некоторых других национальностей. М.: Государственный комитет Российской Федерации по статистике, 1992.
Итоги Всесоюзной переписи населения 1989 года. Том VII. М.: Статистический комитет Содружества Независимых Государств.
Итоги Всероссийской переписи населения 2002 года. Том 4. М.: Статистика России, 2004.
Всероссийская перепись населения 2010 года. Тома 4 и 10: http://www.gks.ru/free_doc/new_site/perepis2010/croc/perepis_itogi1612.htm
1. Finno-Ugric and Samoyedic groups singled out in the all-Russian population census of 2010
![]()
2. Proportional change in the combined Finno-Ugric population (including Samoyedic groups), Russians, Tatars, and the total population of the country: Russian Federation, 1959-2010 (1959 = 100)

![]()
3. Proportional population change among some Finno-Ugric/Samoyedic groups: Russian Federation, 1959-2010 (1959 = 100; IPN = Indigenous Peoples of the North)

![]()
4. Proportional population change among the Vepsians, Saami, Khanty, Mansi, and Samoyedic groups: Russian Federation, 1959-2010 (1959 = 100)

![]()
5. Average number of births per thousand females aged 20-29 years by nationality of the mother: Russian Federation, 2010

![]()
6. Age-sex distribution of the total population and Finno-Ugric population: Russian Federation, 2010

![]()
7. Age-sex distribution of the Karelians, Mari, Vepsians, and Khanty: Russian Federation, 2010
![]()
![]()
![]()